Categories
Uncategorized

Why Magnitude of Payoff is So Important

“If I’d tried for them dinky singles, I could’ve batted around six hundred.” – Babe Ruth

Babe Ruth is considered one of the greatest baseball players of all time. He hit 714 home runs, a league record at the time. Over his career, he collected 2,873 base hits. He was a seven-time World Series champion, and he made baseball’s “All Century” team. However, for many years, Babe Ruth was also known as the “King of Strikeouts.” He led the American League in strikeouts five times and accumulated 1,330 of them in his career. However, despite his large number of strikeouts, he was one of baseball’s greatest hitters, establishing many MLB batting records, including career home runs. Babe Ruth accepted his failures because he knew his successes would more than make up for them. His approach and mindset illustrate one of the most important concepts in portfolio management and investing: expected value or mathematical expectancy. Celebrated hedge fund tycoon George Soros, the man who broke the Bank of England after making a profit of $1 billion by shorting the British pound, once summed up the same concept by stating: “It’s not whether you’re right or wrong that’s important, but how much money you make when you’re right and how much you lose when you’re wrong.” This is also called the Babe Ruth effect. In other words, it is not the frequency of winning that matters but the frequency times the magnitude of the payoff.

However, many people are wired to avoid losses when making risky choices when the probability of different outcomes is unknown. In fact, investors are known to perceive losses on their investments as greater than they actually are. This is outlined in prospect theory, which was formulated in 1979 by Daniel Kahneman and Amos Tversky. Investors naturally prefer to be right more frequently than they are wrong. However, this mindset causes investors to overlook the key concept that the frequency of correctness does not matter as much as the magnitude of correctness.

The understanding of frequency versus magnitude, or in other words, the understanding of winning a few big payoffs while taking small, frequent losses, goes against investors’ intuitions. This investor bias of prioritizing correctness over payoff magnitude goes to show the importance of focusing on expected value when making investment decisions.

For example, take a look at this hypothetical portfolio below:

As you can see, even though the probability of the portfolio going up is less than the probability of the portfolio going down, the magnitude of portfolio return when the portfolio goes up offsets the higher probability of loss when the portfolio goes down. Therefore, the expected value, how much your portfolio is expected to gain or lose on average, is positive.

To sum it all up, investors do not necessarily need to be exactly like Babe Ruth or George Soros to have long-term success in these types of probabilistic exercises. However, it is essential that investors understand expected values, risk management, and perhaps, most importantly, themselves and their own emotional tendencies if they wish to achieve success with their investments. Keep in mind, just because something has a lower probability, it doesn’t mean that it’s not worth betting on.


The views expressed represent the opinion of Passage Global Capital Management, LLC. The views are subject to change and are not intended as a forecast or guarantee of future results. This material is for informational purposes only. It does not constitute as investment advice and is not intended as an endorsement of any specific investment. Stated information is derived from proprietary and nonproprietary sources that have not been independently verified for accuracy or completeness. While Passage Global Capital Management, LLC believes the information to be accurate and reliable, we do not claim or have responsibility for its completeness, accuracy, or reliability. Statements of future expectations, estimates, projections, and other forward-looking statements are based on available information and Passage Global Capital Management, LLC’s views as of the time of these statements. Accordingly, such statements are inherently speculative as they are based on assumption that may involve known and unknown risks and uncertainties. Actual results, performance or events may differ materially from those expressed or implied in such statements.


Categories
Uncategorized

Models of Success

It is a common myth to say that investing is more of an art than a science. In reality, most professional investors will echo Ben Graham’s mantra that active investing requires a combination of quantitative and qualitative analysis. However, in recent decades, ‘quant’ investors have found repeated success by ditching qualitative analysis altogether and instead relying solely on quantitative models. Perhaps the most famous example is Renaissance Technologies’ Medallion fund, which returned about 66% annually gross of fees from 1988 to 2018 according to the Wall Street Journal. Even though Renaissance’s models are remarkably complex and require millions of lines of computer code, the key to Renaissance’s success starts with their reliance on algorithms over intuition.

There have been numerous examples in other fields of simple formulas being able to outperform expert judgement. Nobel Prize winner Daniel Kahneman outlines several examples in his acclaimed book Thinking Fast and Slow. In one illustration, Kahneman tells of how Princeton economist Orley Ashenfelter developed a simple formula to forecast future prices of high-end wines. The formula’s output actually proved more accurate than wine experts’ price estimates. In another study, researcher Paul Meehl was able to develop a statistical algorithm to predict the grades of college freshmen using only the students’ high school grades and one aptitude test. The algorithm’s predictions were closer to the truth than 78% of the guesses of trained counselors who had interviewed the students and been given the student’s high school grades, four aptitude tests, and a personal statement. The algorithm was able to filter out the noise and focus on the key variables. Often human judgement is overwhelmed by the vast amount of information available and can be misled by inherent biases.

Human judgement is inconsistent, even for experts. Kahneman references several studies of experts, including radiologists and auditors, making one conclusion and then unknowingly reaching a different verdict after looking at the same data on a different occasion. In addition, humans are easily influenced by others. Famed investor Joel Greenblatt provided an anecdote on the Masters in Business podcast that illustrated this tendency in which he asked a class of ninth graders to guess the number of jelly beans in a jar. Greenblatt had the students write down their guesses on an index card. Then, he gave the students an opportunity to change their answers based on what other students had guessed. As it turns out, the first guesses were much closer on average than the second guesses in which students were influenced by their classmates.

How does this apply to investing? Consider all the headlines that investors are bombarded with each day. Most of this data is noise. It is exceedingly difficult for most investors, even professional ones, to extract the relevant information and not be influenced by the irrelevant, or incorrect, information. This is the essence of why models are critical. Greenblatt himself touts a “Magic formula” which ranks stocks based on a few fundamental criteria. Other quantitative managers develop their own models and rules. It is key, however, that managers have a deep understanding of the markets in which they operate in order to build robust models. Developing a good model requires domain knowledge, experience, and patience. Furthermore, the manager must have enough conviction and discipline to follow the model without attempting to override it. By strictly following an algorithm and avoiding intuitive judgements, investors can avoid the behavioral traps that they could otherwise fall into and best position themselves for investment success over the long-term.

The views expressed represent the opinion of Passage Global Capital Management, LLC. The views are subject to change and are not intended as a forecast or guarantee of future results. This material is for informational purposes only. It does not constitute as investment advice and is not intended as an endorsement of any specific investment. Stated information is derived from proprietary and nonproprietary sources that have not been independently verified for accuracy or completeness. While Passage Global Capital Management, LLC believes the information to be accurate and reliable, we do not claim or have responsibility for its completeness, accuracy, or reliability. Statements of future expectations, estimates, projections and other forward-looking statements are based on available information and Passage Global Capital Management, LLC’s views as of the time of these statements. Accordingly, such statements are inherently speculative as they are based on assumption that may involve known and unknown risks and uncertainties. Actual results, performance or events may differ materially from those expressed or implied in such statements.

Categories
Uncategorized

Skill Versus Luck

Paul DePodesta, a former baseball executive and one of the protagonists in Michael Lewis’s Moneyball, shares a story about playing blackjack in Las Vegas when a guy to his right, sitting on 17, ask for a hit. Everyone at the table is surprised and even the dealer asks if he is sure. The player nods yes, and the dealer produces a four and says, “Nice hit.” But was it really a smart play? Of course not (unless you work for the casino). The probability of going bust with a 17 is 69%. The player was simply lucky. If he continued to hit on every 17 he had been dealt, he would lose most of the time.

On the other side of the coin, sometimes decisions that may have seemed sound at the time they were made result in unfavorable outcomes. Consider an example highlighted by poker champion Annie Duke in her book Thinking in Bets: Making Smarter Decisions When You Don’t Have All the Facts. It involves one of the most infamous play calls in the history of football: the decision by Seattle Seahawks coach Pete Carroll to throw the ball at the one-yard line rather than hand the ball off to star running back Marshawn Lynch to end Super Bowl XLIX. The pass was intercepted in the end-zone and the decision cost the Seahawks not only the game, but the NFL championship. Carroll was widely ridiculed for the decision but perhaps the hate is undeserved considering that an incomplete pass would have stopped the clock giving the Seahawks some much needed time to score. Additionally, according to Duke, only 2% of passes from the 1-yard line within the previous 15 years had been intercepted. In all likelihood, the play should have either resulted in a touchdown or a clock stoppage giving the Seahawks more chances to run the ball. Because of the outcome, football fans perceive the play call as an atrocious one.

These anecdotes highlight a cognitive bias known as outcome bias. This has to do with one of the most fundamental and underappreciated concepts in sporting events, gambling and investing: process versus outcome (or skill versus luck). Just like the gambler in the hit-on-17 story, investors tend to make similar errors by placing too much weight on the outcome of a decision rather than the process by which the decision was made. The focus on the outcome is to some degree understandable because the outcome is what ultimately matters. However, it could be due to pure luck or some other random factors. People are not good at understanding the interplay between luck and skill. Luck is the force that brings good fortune by chance and not as a result of effort or ability. Skill, on the other hand, is the ability to do something competently due to learned power or acquired knowledge.

Some activities involve more luck than skill (e.g. playing roulette versus investing). There is, in fact, a simple way of determining whether an activity is based on skill proposed by Wall Street investment strategist, author, and professor Michael Mauboussin – just ask if the player can lose on purpose. If they can, it is a skill-based game (to a degree). If they cannot, luck plays a major role (again, to a degree).

A process is simply a methodology utilized to achieve a goal. It could be a simple checklist, or it could be a more sophisticated approach. Processes concentrate on the specific actions that must be followed in a discipled and systematic way, regardless of results. In investing, a traditional process might involve analyzing the last five years of financial statements for a company before buying their stock. Alternatively, more quantitatively oriented investors might develop intricate models with pre-defined rules to decide which stocks to buy and sell.

But investors often are mistaken by associating good outcomes with skill. Often, outsized gains are the result of a lucky stretch for a particular style of investing with the eventuality of that luck running out. Over time, abnormal returns are bound to revert to the mean, or average, as dictated by the law of large numbers. On the other hand, the best long-term money managers all emphasize a systematic and informed process. They are not concerned with failure in the short run due to factors outside of their control (e.g. global pandemic; shifting market sentiment; sudden outbreak of geopolitical events; etc.)

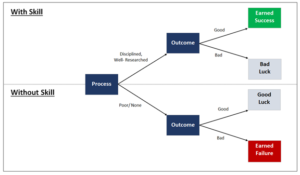
Jay Russo and Paul Schoemaker emphasize the importance of this process-versus-outcome decision making in their book Winning Decisions: Getting It Right the First Time (see Graph below). Their main point is that an individual who relies on process-based decision making deserves praise regardless of the outcome. Likewise, a person who uses a poor process but is met with a good outcome deserves neither praise nor promotion. This fortunate individual is simply the recipient of dumb luck. This is why it is so essential that investors shun activities such as chasing hot stocks or mutual funds that would make them vulnerable to the influence of psychological biases such as herding behavior or short-term oriented speculative trading. Instead, they should follow a more process-driven system to make informed decisions with a long-term perspective. As the co-founder and CEO of Twitter Jack Dorsey has opined, success is never accidental.


With or Without Skill Image
The views expressed represent the opinion of Passage Global Capital Management, LLC. The views are subject to change and are not intended as a forecast or guarantee of future results. This material is for informational purposes only. It does not constitute as investment advice and is not intended as an endorsement of any specific investment. Stated information is derived from proprietary and nonproprietary sources that have not been independently verified for accuracy or completeness. While Passage Global Capital Management, LLC believes the information to be accurate and reliable, we do not claim or have responsibility for its completeness, accuracy, or reliability. Statements of future expectations, estimates, projections and other forward-looking statements are based on available information and Passage Global Capital Management, LLC’s views as of the time of these statements. Accordingly, such statements are inherently speculative as they are based on assumption that may involve known and unknown risks and uncertainties. Actual results, performance or events may differ materially from those expressed or implied in such statements.

Categories
Uncategorized

A Scientific Approach to Investing

Many areas of modern life rely on scientific research and are guided systematically by well-defined rules. When designing self-driving cars or developing surgical robots, fields such as physics, math, statistics, and computer science are all relied upon. Finance and investing are no different. Finding ways to maximize gains while minimizing downside risks is the goal of investment analysis and portfolio management. There are various schools of thought on how to achieve this, but two popular examples are 1.) traditional fundamental analysis and 2.) a more quantitative approach. The former is the classic way to examine company financials and evaluate investments. Quantitative investing, on the other hand, is based on identifying reasonable, repeatable, and measurable hypotheses regarding behaviors of financial instruments and markets. It has advanced to a highly specialized discipline, which has offered quantitative investors additional tools and insights as well as speed thanks largely to a series of developments:

Computational power has roughly doubled every two years since the 1970s

There has been an exponential increase in data availability accompanied by a decrease in storage costs due mostly to cloud computing

Powerful new algorithms in AI (“Artificial Intelligence”) and its subset of machine learning have been developed from more traditional techniques in fields such as computer science and statistics

The views expressed represent the opinion of Passage Global Capital Management, LLC. The views are subject to change and are not intended as a forecast or guarantee of future results. This material is for informational purposes only. It does not constitute as investment advice and is not intended as an endorsement of any specific investment. Stated information is derived from proprietary and nonproprietary sources that have not been independently verified for accuracy or completeness. While Passage Global Capital Management, LLC believes the information to be accurate and reliable, we do not claim or have responsibility for its completeness, accuracy, or reliability. Statements of future expectations, estimates, projections, and other forward-looking statements are based on available information and Passage Global Capital Management, LLC’s views as of the time of these statements. Accordingly, such statements are inherently speculative as they are based on assumption that may involve known and unknown risks and uncertainties. Actual results, performance or events may differ materially from those expressed or implied in such statements.
Categories
Uncategorized

Prospect Theory & Investments

In 1738 the Swiss mathematician Daniel Bernoulli wrote a famous essay in which he introduced utility theory about the psychological value of money. Bernoulli’s model assumed that the utility that was assigned to a given state of wealth did not vary with the decision maker’s initial state of wealth.

Later in the 20th century, two psychologists, Amos Tversky and Daniel Kahneman (the 2002 Nobel Memorial Prize winner in Economic Sciences), concluded in their 1979 seminal paper, “Prospect Theory: An Analysis of Decision under Risk,” that people make decisions based on changes of wealth as opposed to states of wealth. In an investing context, when looking at brokerage account statements, people psychologically place greater emphasis on the gains and losses for the period than the ending balance of their portfolio.

As an example, consider two investors: John and Mary. John’s wealth has gone up from $1 million to $1.5 million, and Mary’s wealth has gone down from $4 million to $3.5 million. Who is happier? Obviously, John is happier than Mary. Who is better off financially? Mary is better off given her larger amount of wealth.

Bernoulli’s model focuses on the utility of wealth, which essentially measures who is better off financially, but ignores the all-important role of the reference point, the earlier state relative to which gains and losses are evaluated. While Bernoulli’s utility theory requires one to know only the state of wealth to determine its utility, prospect theory also requires knowing the reference state.

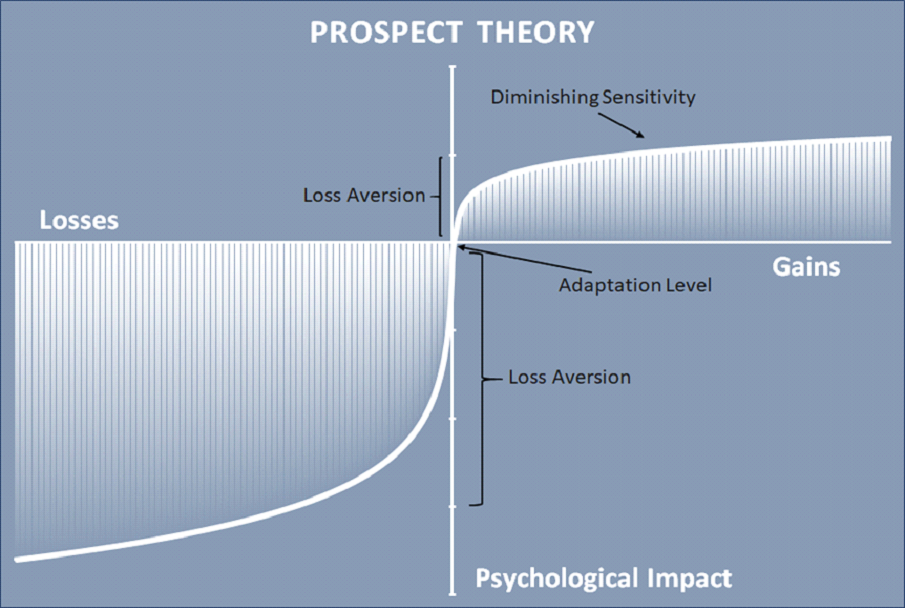
Prospect theory has three cognitive principles that govern the value of outcomes: Adaptation level: this is the evaluation relative to a neutral reference point. Financial outcomes that are above the reference points are gains. Below the reference points are losses.

Diminishing sensitivity: the subjective difference between $900 and $1000 is much smaller than the difference between $100 and $200.

Loss aversion: when people think in terms of the final state of wealth, they tend to be much less risk-averse. However, when people think in terms of gains and losses, they tend to be more risk-averse, because losses loom much larger than gains.

To demonstrate a loss aversion example, consider a flip of a coin. If it lands heads, you gain $150, but if it is tails, you lose $100. Is this gamble attractive enough for you to play? This will require you to evaluate the psychological benefit of gain versus the psychological cost of loss. Most people tend to avoid this gamble for fear of potentially losing $100 versus the hope of gaining $150 despite the fact that the expected value of the gamble is positive. This helps explain risk aversion in the sense that the disutility of losing $1 is higher than the utility of winning $1.


In conclusion, prospect theory highlights the short-term asymmetrical emotional impact of gains and losses on people as opposed to long-term prospects of wealth. It attempts to model real-life choices, rather than optimal and rational decisions, thus creating a psychologically more accurate description of the decision-making process under uncertainty.

The views expressed represent the opinion of Passage Global Capital Management, LLC. The views are subject to change and are not intended as a forecast or guarantee of future results. This material is for informational purposes only. It does not constitute as investment advice and is not intended as an endorsement of any specific investment. Stated information is derived from proprietary and nonproprietary sources that have not been independently verified for accuracy or completeness. While Passage Global Capital Management, LLC believes the information to be accurate and reliable, we do not claim or have responsibility for its completeness, accuracy, or reliability. Statements of future expectations, estimates, projections, and other forward-looking statements are based on available information and Passage Global Capital Management, LLC’s views as of the time of these statements. Accordingly, such statements are inherently speculative as they are based on assumption that may involve known and unknown risks and uncertainties. Actual results, performance or events may differ materially from those expressed or implied in such statements.

Categories
Uncategorized

Expected Utility Theory & Investments

Decision making plays a key role virtually in every aspect of human life such as buying a house or choosing a career. It is the process of selecting a course of action from available options so that the desired result or predetermined objective may be accomplished. However, when decision making is about the future, uncertainty and risk become involved. For instance, how much should one save for retirement given the uncertainty involving such variables as future income and longevity? What is the expected return on different investment choices given the risks? In economics, utility is a measure of how much benefit consumers derive from certain goods or services. From a finance standpoint, it refers to how much benefit investors obtain from portfolio performance considering risk.

It is assumed that an individual, when making a decision in the face of incomplete knowledge, will choose to act in a manner that will result in the highest expected utility with respect to the individual’s subjective probability. This is the expected utility theory that was first introduced by Swiss mathematician Daniel Bernoulli and was later expanded upon in the 20th century by the mathematician John von Neumann and the economist Oskar Morgenstern.

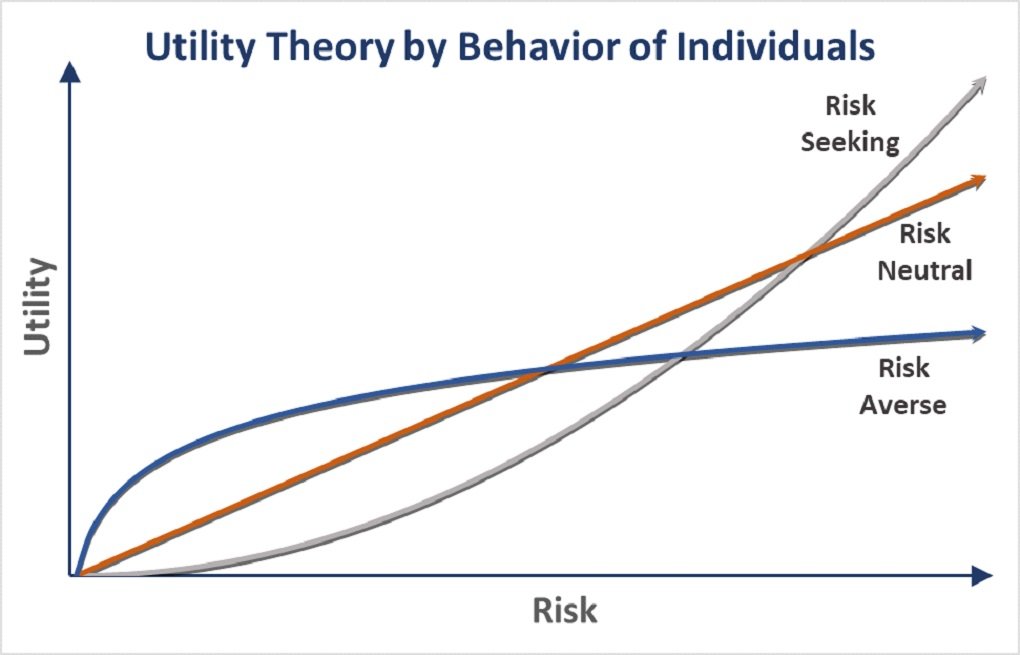
There are three types of individual behaviors that the von Neumann–Morgenstern expected utility function can be used to explain: risk-averse, risk-neutral, and risk-seeking. For example, consider an individual deciding to invest in one of two portfolio strategies, Strategy A or Strategy B. Suppose that Strategy A has a 5% chance of producing $80, a 90% chance of producing $100, and a 5% chance of producing $120. Thus, the expected payoff from Strategy A would be calculated as follows:

Expected Payout for Strategy A: 5% x $80 + 90% x $100 + 5% x $120 = $100
Now suppose Strategy B has the same payoffs but the respective probabilities for the payoffs change to 40%, 20%, and 40%. It is easy to verify that the expected payoff is still $100:

Expected Payout for Strategy B: 40% x $80 + 20% x $100 + 40% x $120 = $100

In other words, mathematically speaking, nothing has changed. The only difference is that the probabilities of the lowest and highest payoffs rose at the expense of the middle one. This means there is more variance (or risk) associated with the possible payoffs. Despite the strategies being mathematically equivalent, the investor may not see them as equal. If she values both investment options equally, she is considered risk neutral. The implication is that she equally values a payoff of $100 with any set of probabilistic payoffs whose expected value is also $100. If she prefers Strategy A over Strategy B, she places higher value on less variability in payoffs. In that regard, by preferring more certainty, she is considered risk averse. Finally, if she actually prefers the increase in variability, she is considered risk-seeking. In a gambling context, a risk averter puts higher utility on the expected value of the gamble than on taking the gamble itself. Conversely, a risk-seeker prefers to take the gamble rather than settle for a payoff equal to the expected value of that gamble.

The implication of the expected utility theory is that individuals seek to maximize the expectation of utility rather than monetary values alone. Since utility functions are subjective, different people can approach any given risky event with quite different valuations. Having a solid understanding of one’s utility of money can help investors make investment decisions that are best suited to their risk attitudes and investment strategies.

The views expressed represent the opinion of Passage Global Capital Management, LLC. The views are subject to change and are not intended as a forecast or guarantee of future results. This material is for informational purposes only. It does not constitute as investment advice and is not intended as an endorsement of any specific investment. Stated information is derived from proprietary and nonproprietary sources that have not been independently verified for accuracy or completeness. While Passage Global Capital Management, LLC believes the information to be accurate and reliable, we do not claim or have responsibility for its completeness, accuracy, or reliability. Statements of future expectations, estimates, projections, and other forward-looking statements are based on available information and Passage Global Capital Management, LLC’s views as of the time of these statements. Accordingly, such statements are inherently speculative as they are based on assumption that may involve known and unknown risks and uncertainties. Actual results, performance or events may differ materially from those expressed or implied in such statements.

Categories
Uncategorized

What is Factor Investing?

Of the specialized investment strategies popular across the board today, factor investing is one of the most interesting. Popular with both quantitative investors and those with a more traditional approach to money management, factor investing is a discipline heavily focused on research. With its roots in the investors of the 1970s, factor investing seeks to identify distinct factors that drive stock returns.

By quantifying and identifying these factors and their presence in other instruments, an investor can theoretically make smart strategic decisions to grow their assets. What are some of the things investors look for that hint at future success?

Understanding the “Factors” in Factor Investing

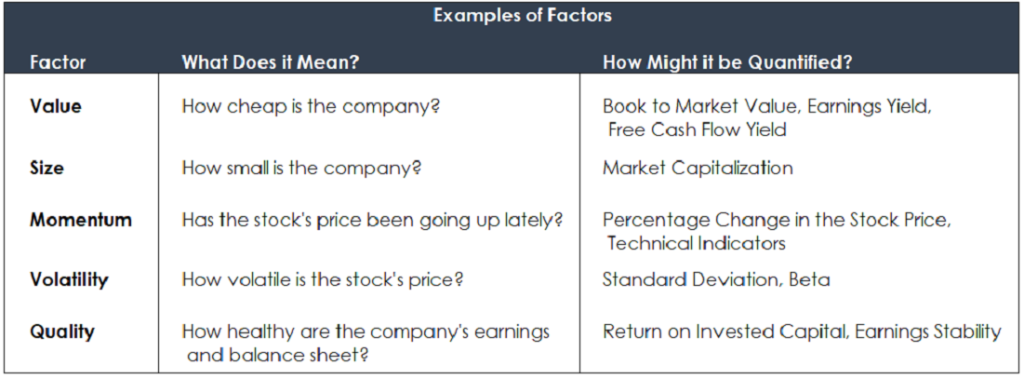
The popularity of factor investing can be credited to Eugene Fama and Kenneth French, creators of the Fama-French Three Factor Model. This model identified three factors that drove stock returns:

Market Risk

Size: Smaller-cap stocks tended to outperform larger ones

Value: Cheap stocks, as measured with the book to market ratio, tended to outperform expensive ones

Other factors that have been added to the model over the years include liquidity, quality, and momentum. Ultimately, the investments that perform well are typically those in which you can identify the presence of multiple favorable factors.

What Risks Does a Factor-Based Approach Entail? Every strategy involves some level of risk, and choosing investments based on market factors is no different. First, it is not possible to fully assess all the factors that drive returns. Second, market volatility or a sudden downswing may bring new factors into play. Just as there are attributes that may make your investments smart choices, there are also some that can negatively impact your investments in the same degree. When market conditions change rapidly, what made your selections successful could work against them instead.

Incorporating Advanced Strategies into Your Investment Portfolio

With a substantial volume of trades on the market every day and new businesses entering the arena all the time, identifying the factors outlined above often proves challenging. Separating the signal from the noise can require an immense amount of research and continual re-evaluation of your assumptions about the business. There is thankfully a better way to tackle this problem.

At Passage Global Capital Management, we believe that the underlying principles of factor investing can be a vital contributor to a sound strategy. We rely on quantitative investment methods powered by our rich insights into the market and unique algorithmic models. By peering into the data with the power of modern technology, we work together with our clients to produce results that align with your investment goals. Contact us today for further details.

The views expressed represent the opinion of Passage Global Capital Management, LLC. The views are subject to change and are not intended as a forecast or guarantee of future results. This material is for informational purposes only. It does not constitute as investment advice and is not intended as an endorsement of any specific investment. Stated information is derived from proprietary and nonproprietary sources that have not been independently verified for accuracy or completeness. While Passage Global Capital Management, LLC believes the information to be accurate and reliable, we do not claim or have responsibility for its completeness, accuracy, or reliability. Statements of future expectations, estimates, projections, and other forward-looking statements are based on available information and Passage Global Capital Management, LLC’s views as of the time of these statements. Accordingly, such statements are inherently speculative as they are based on assumption that may involve known and unknown risks and uncertainties. Actual results, performance or events may differ materially from those expressed or implied in such statements.

Categories
Uncategorized

What is Tail Risk?

Risk is a potential threat to every investment, no matter how large or small. It could be as simple as bad weather threatening an agricultural investment, or as complex as global geopolitics or a pandemic outbreak impacting the entire world and financial markets. For any investor, addressing risk and managing it appropriately is one of the keys to building towards a positive outcome. To do so requires knowing what risks you face.

What is Tail Risk?
Tail risk refers to an unlikely event. To get at the heart of the question, let’s go back to statistics 101 for a moment.
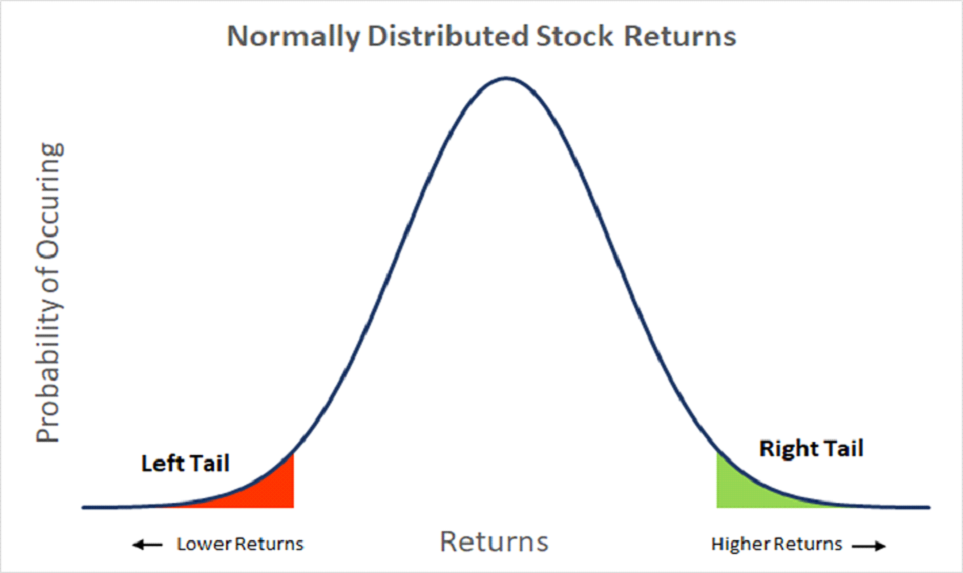
In a “normal distribution” that measures how close any given result is to the average expected result, there are “tails” at either end of the chart representing the most unlikely outcomes. In the financial world, one common definition considers the tails to be any result which is three or more standard deviations away from the average. For example, the right tail risk of a stock, or positive tail risk, would represent an upwards move much larger than average, accounting for the regular volatility of the stock. Of course, left tail risk is what concerns most investors.

Left tail risk is what we really mean when we talk about tail risk. Left tail events are significant downward moves that can not only harm investors’ portfolios but also their psychological makeup. Of course, the example above assumes that stock returns are normally distributed. In reality, empirical studies have shown that returns tend to be negatively skewed, meaning that left tail events are usually more impactful than right tail events. Perhaps this can best be understood with the old adage that markets go up like an escalator and down like an elevator. Tools such as Conditional Value at Risk (CVaR) exist to help account for this non-normality in measuring tail risk.

Commonly cited examples of tail risk events include the 2008 financial crisis and the COVID-19 pandemic, which we are experiencing now. These are extreme outlier events that negatively impacted many investments. Tail risk is one of the biggest potential threats to your portfolio, but it is also one of the hardest to manage — the only way to guard against it fully would be to see the future with a crystal ball.

So, Is Diversification the Solution?

In most investment strategies, diversifying the portfolio is often enough to mitigate a considerable amount of risk. By limiting your exposure to the threats faced by certain asset classes and spreading your money around, a sudden downturn in one area won’t sink your entire investment. In a tail risk scenario, however, when a large-scale event causes broader problems, diversification will not always be enough.

Just as a rising tide lifts all boats, a tsunami sinks them. In market tail risk scenarios, equity correlations tend to rise. In addition, other asset classes with historically low correlations to equities may not act as a good protector against these events (look no farther than the real estate market in 2008). If you do not adequately account for tail risk, these sudden and unpredictable events become much more difficult to weather. However, pulling your money out of the market is not a good long-term strategy, and a strategy that is too low-risk won’t generate appreciable returns. What’s the solution?

Active Risk Management

Active management of your investments and a dynamic approach to those assets can help you to build in some protections against tail risk events, which could include making changes as necessary in the allocation of funds and hedging your investments with the proper tools to better withstand a storm of financial turmoil.

The usage of machine learning algorithms and AI could revolutionize the way investors approach tail risk. Although these events might be outliers, planning for them by effectively and actively managing investments may help to limit their impact on your portfolio. Hedging against a market catastrophe might not be easy, but it is a necessity — and good insights make the difference.

The views expressed represent the opinion of Passage Global Capital Management, LLC. The views are subject to change and are not intended as a forecast or guarantee of future results. This material is for informational purposes only. It does not constitute as investment advice and is not intended as an endorsement of any specific investment. Stated information is derived from proprietary and nonproprietary sources that have not been independently verified for accuracy or completeness. While Passage Global Capital Management, LLC believes the information to be accurate and reliable, we do not claim or have responsibility for its completeness, accuracy, or reliability. Statements of future expectations, estimates, projections, and other forward-looking statements are based on available information and Passage Global Capital Management, LLC’s views as of the time of these statements. Accordingly, such statements are inherently speculative as they are based on assumption that may involve known and unknown risks and uncertainties. Actual results, performance or events may differ materially from those expressed or implied in such statements.

Categories
Uncategorized

Infecting the Economy

The “R naught” (pronunciation of the term R0) is not an often-heard vocabulary word unless you saw the 2011 American medical thriller movie “Contagion” about a worldwide pandemic of a new virus. It is also often encountered in the epidemiology as well as public health literature, and it is a crucial part of public health planning during an epidemic like the current coronavirus (Covid-19) outbreak spreading widely in China and around the world. The basic reproduction number (R0), also called the basic reproduction ratio, is an epidemiologic metric that was first formulated in the 1970s by the German mathematician Klaus Dietz. It is used to represent the average number of people that an infectious individual will infect in a specific population. The potential size of an outbreak or epidemic often is based on the magnitude of the R0 value for that event. In the early stages of an outbreak, R0 is estimated to be around two, which suggests a single infection will, on average, become two, then four, then eight and so on. This can be seen from past outbreaks such as pandemic flu as well as Ebola and now with coronavirus.

Considering that there have been nearly 80,000 confirmed cases of the coronavirus in China and more than 7,000 cases in 58 other countries, including 62 infections in the U.S., according to the World Health Organization, the potential risk of a global pandemic in the coming year should not be underestimated. Adding to the uncertainty, development of a successful vaccine is taking longer than expected and quarantines and other interventions are not effectively working to contain transmissions.

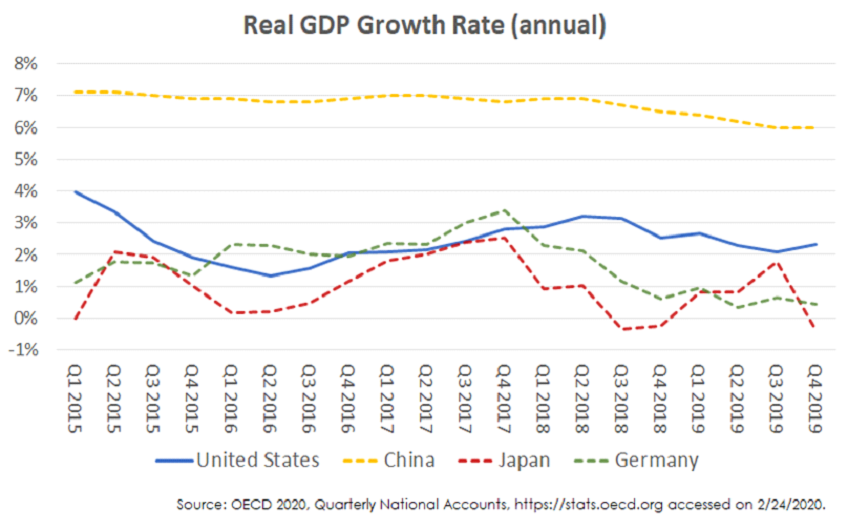
There are also economic consequences and financial risks given the fact that the Chinese economy is now more than four times larger than it was at the time of the 2003 SARS outbreak and it is considerably more vital as a source of demand and for its central role in many manufacturing supply chains. ANZ predicts Chinese growth in gross domestic product could fall to as low as 3.2% this quarter, half the rate of the first three months of 2019.

An expected slowdown in China also comes at a time when the eurozone economy is growing at the slowest rate in seven years. This is particularly true for Germany’s export-oriented economy. Deutsche Bank’s chief economist estimated that the coronavirus outbreak would knock 0.2 percentage points off first-quarter growth for Germany, making a technical recession quite probable after zero growth in the fourth quarter.

Japan is also facing the prospects of a recession after a dreadful 6.3% decline in GDP for the fourth quarter of 2019. However, the coronavirus outbreak should only have a limited impact on U.S. growth, thanks largely to America’s booming consumer economy and a supportive Federal Reserve, which is closely monitoring the developments. “We know that there will be very likely some effects on the United States,” Jay Powell, U.S. Federal Reserve chairman, said during congressional testimony on February 11. “The question we’ll be asking is: Will these be persistent effects that could lead to a material reassessment of the outlook?” According to UBS, the most likely ways in which the virus could dampen U.S. growth are a decline in Chinese tourism and weaker demand for American exports. The worse the outbreak becomes, the longer it persists, and the heavier the impact on the global economy, the more likely it is that the Fed will ease policy again. However, if history is any guide, the coronavirus will eventually come under control, and global economies will get back on track to grow again.

The views expressed represent the opinion of Passage Global Capital Management, LLC. The views are subject to change and are not intended as a forecast or guarantee of future results. This material is for informational purposes only. It does not constitute as investment advice and is not intended as an endorsement of any specific investment. Stated information is derived from proprietary and nonproprietary sources that have not been independently verified for accuracy or completeness. While Passage Global Capital Management, LLC believes the information to be accurate and reliable, we do not claim or have responsibility for its completeness, accuracy, or reliability. Statements of future expectations, estimates, projections, and other forward-looking statements are based on available information and Passage Global Capital Management, LLC’s views as of the time of these statements. Accordingly, such statements are inherently speculative as they are based on assumption that may involve known and unknown risks and uncertainties. Actual results, performance or events may differ materially from those expressed or implied in such statements.

Categories
Uncategorized

An Introduction to Quantitative Investing

If timely and accurate information is a vital factor in analyzing stocks and key to smart investments, today’s investors face nothing short of a tidal wave of data. In the face of thousands of data points about every public company, from their financial ratios to news breaking headlines to social media postings, it is often difficult to make sense of all the noise. This complexity makes one thing abundantly clear: no human can analyze it all on his or her own. A powerful computer system, on the other hand, may have everything we need to try to identify and understand where the best investments might hide.

Thus, we have the heart of quantitative investing, one of the growing investment strategies around the world today. More and more investors have been gravitating toward algorithm-driven quantitative strategies at the expense of traditionally managed funds. In this discipline, experienced individuals with data and computer science backgrounds called “quants” rely on high-powered computers, vast data sets, and sophisticated algorithms to extract correlations and insights in order to systematically exploit patterns in securities prices and markets trends. What is this strategy all about, and what can it mean for your investments?

Understanding What Quants Do: What’s the Quantitative Model All About?

Almost everything about a stock’s performance and the overall marketplace is quantifiable — we can express it in some form with numbers. Analyzing these numbers, determining their relationships to one another, deciphering patterns, and using them to make predictions are the core activities involved in quantitative investing. By interpreting past events and current trends, quants hope to draw conclusions that lead them to generate higher returns with lower risk.

There are several disciplines within quantitative analysis such as factor investing and statistical arbitrage. Data sources also range widely from publicly accessible stock prices to unique alternative data sets. Examples of alternative data include satellite pictures of retailers’ parking lots and sentiment of companies’ financial statements.

Why Quantitative Investing Remains the Wave of the Future

The earliest quants decades ago did not have access to the same level of computing power, advanced techniques, and big data available today. That made large-scale analysis more difficult and necessitated more narrow focuses. Today, many of those limits are gone. Quants have access to extremely powerful computers, and with the advent of cloud computing, the sky is the limit when it comes to analyzing the data produced by the market.

There’s no shortage of information, either. Where once it was a problematic barrier to effective analysis, today the amount of data is a blessing. A well-crafted algorithm can comb through millions of data points in a fraction of the time it would take for a human to reach the same conclusion. With so much activity, market inefficiencies become harder and harder to spot. With advances in technology such as machine learning, more patterns will likely emerge over time. These advances can make quantitative investing appealing to everyone from the high-flying trader to the retiree with a moderate appetite for risk, and it may explain why quantitative investing accounts for $1 trillion in market value.

Are There Any Issues with Quantitative Investing Models?

It’s important to note that quants aren’t all-knowing and all-seeing. The models are only as good as those who design them and the data input. It’s certainly possible for biases and incorrect assumptions to make their way into a model. A quant model tries to tell the future, but it can’t produce the exact details. Historically, quantitative market analysis has tended to focus on past results, adding new data as it becomes available.

A balanced investment approach may rely on quantitative principles while also following the best practices for managing risk. The right solutions are transparent about their results and upfront with what you can expect for your funds.

The views expressed represent the opinion of Passage Global Capital Management, LLC. The views are subject to change and are not intended as a forecast or guarantee of future results. This material is for informational purposes only. It does not constitute as investment advice and is not intended as an endorsement of any specific investment. Stated information is derived from proprietary and nonproprietary sources that have not been independently verified for accuracy or completeness. While Passage Global Capital Management, LLC believes the information to be accurate and reliable, we do not claim or have responsibility for its completeness, accuracy, or reliability. Statements of future expectations, estimates, projections, and other forward-looking statements are based on available information and Passage Global Capital Management, LLC’s views as of the time of these statements. Accordingly, such statements are inherently speculative as they are based on assumption that may involve known and unknown risks and uncertainties. Actual results, performance or events may differ materially from those expressed or implied in such statements.